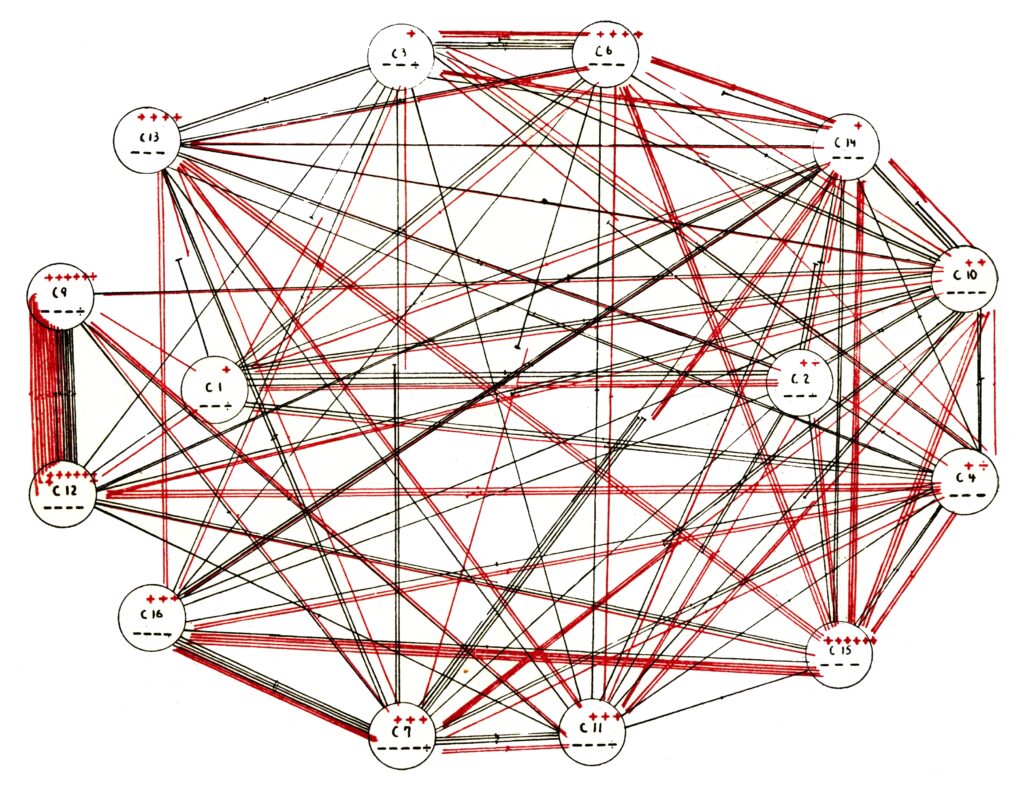
Blogging gets a bit harder throughout the start of the academic term. This is why I return to this series of image from The Connectivity of Things just now. Chapter 6 of the book tells a visual history of the network diagram. It follows the early history of graph theory in mathematics and chemistry. But the payoff here is a true crime history of sociology. While the name of Jacob Levy Moreno might sound familiar, the name of social psychologist Helen Hall Jennings is largely unknown even to scholars of social networks. Yet, it was Jennings who provided Moreno with a set of innovative methods to gather data on social relations. The sociometric test is what allowed for a visual formalization of a given network’s data. While Jennings still had a chapter of her own in the 1934 first edition of Moreno’s book Who Shall Survive, her work was hidden in a list of (numerous) references in the second edition of 1953. This is why I have started to reference both versions as written by Moreno and Jennings.
In the 1953 second edition, Moreno also made strong claims regarding “his” visual method of network visualization. A lot of the sociometric diagrams have been drawn by women though. Just consider an image like The Lady Bountiful, which was drawn by student assistant Pauline Lee in 1938. But in this case, Moreno’s copyright assertion for visualizing social networks has been more than mere rhetoric. His 1920s diagrams of stage movements in improvised theater (Das Stegreiftheater, 1924) can indeed be regarded as a crucial pathway towards visualizing dynamic social networks. But we should still be careful whom to give credit to when it comes to the methods of testing and visualizing social networks.

