Am 17. Oktober lese ich um 13 Uhr auf der Frankfurter Buchmesse aus meinem kommenden Kreditkarten-Buch. Moderiert von Wolfram Burckhardt, dem Leiter des famosen Kulturverlags Kadmos. Mit großem Dank an die Kurt-Wolff-Stiftung für ihre LESEINSEL der unabhängigen Verlage. Support your independent book publishers and sellers! Wer nicht vor Ort sein konnte, kann gerne die Aufzeichnung auf YouTube anschauen.
On The Connectivity of Things: Network Cultures since 1832
What is the truth about the network? And what might it tell us in our current situation? After five years of translation and fine-grained updating, Sebastian Giessmann’s seminal book on The Connectivity of Things: Network Cultures since 1832 finally came out in October 2024 with MIT Press. The full text is available in open access.
While the translated book’s historical narrative is deeply rooted in developments of 19th and 20th century infrastructural history, it is also a key work of German media theory. There’s much to discuss here for historians of technology, be it the notion of “cultural techniques,” the seemingly Western grounding of network practice and thought, and the in/visible work of networking in material cultures itself.
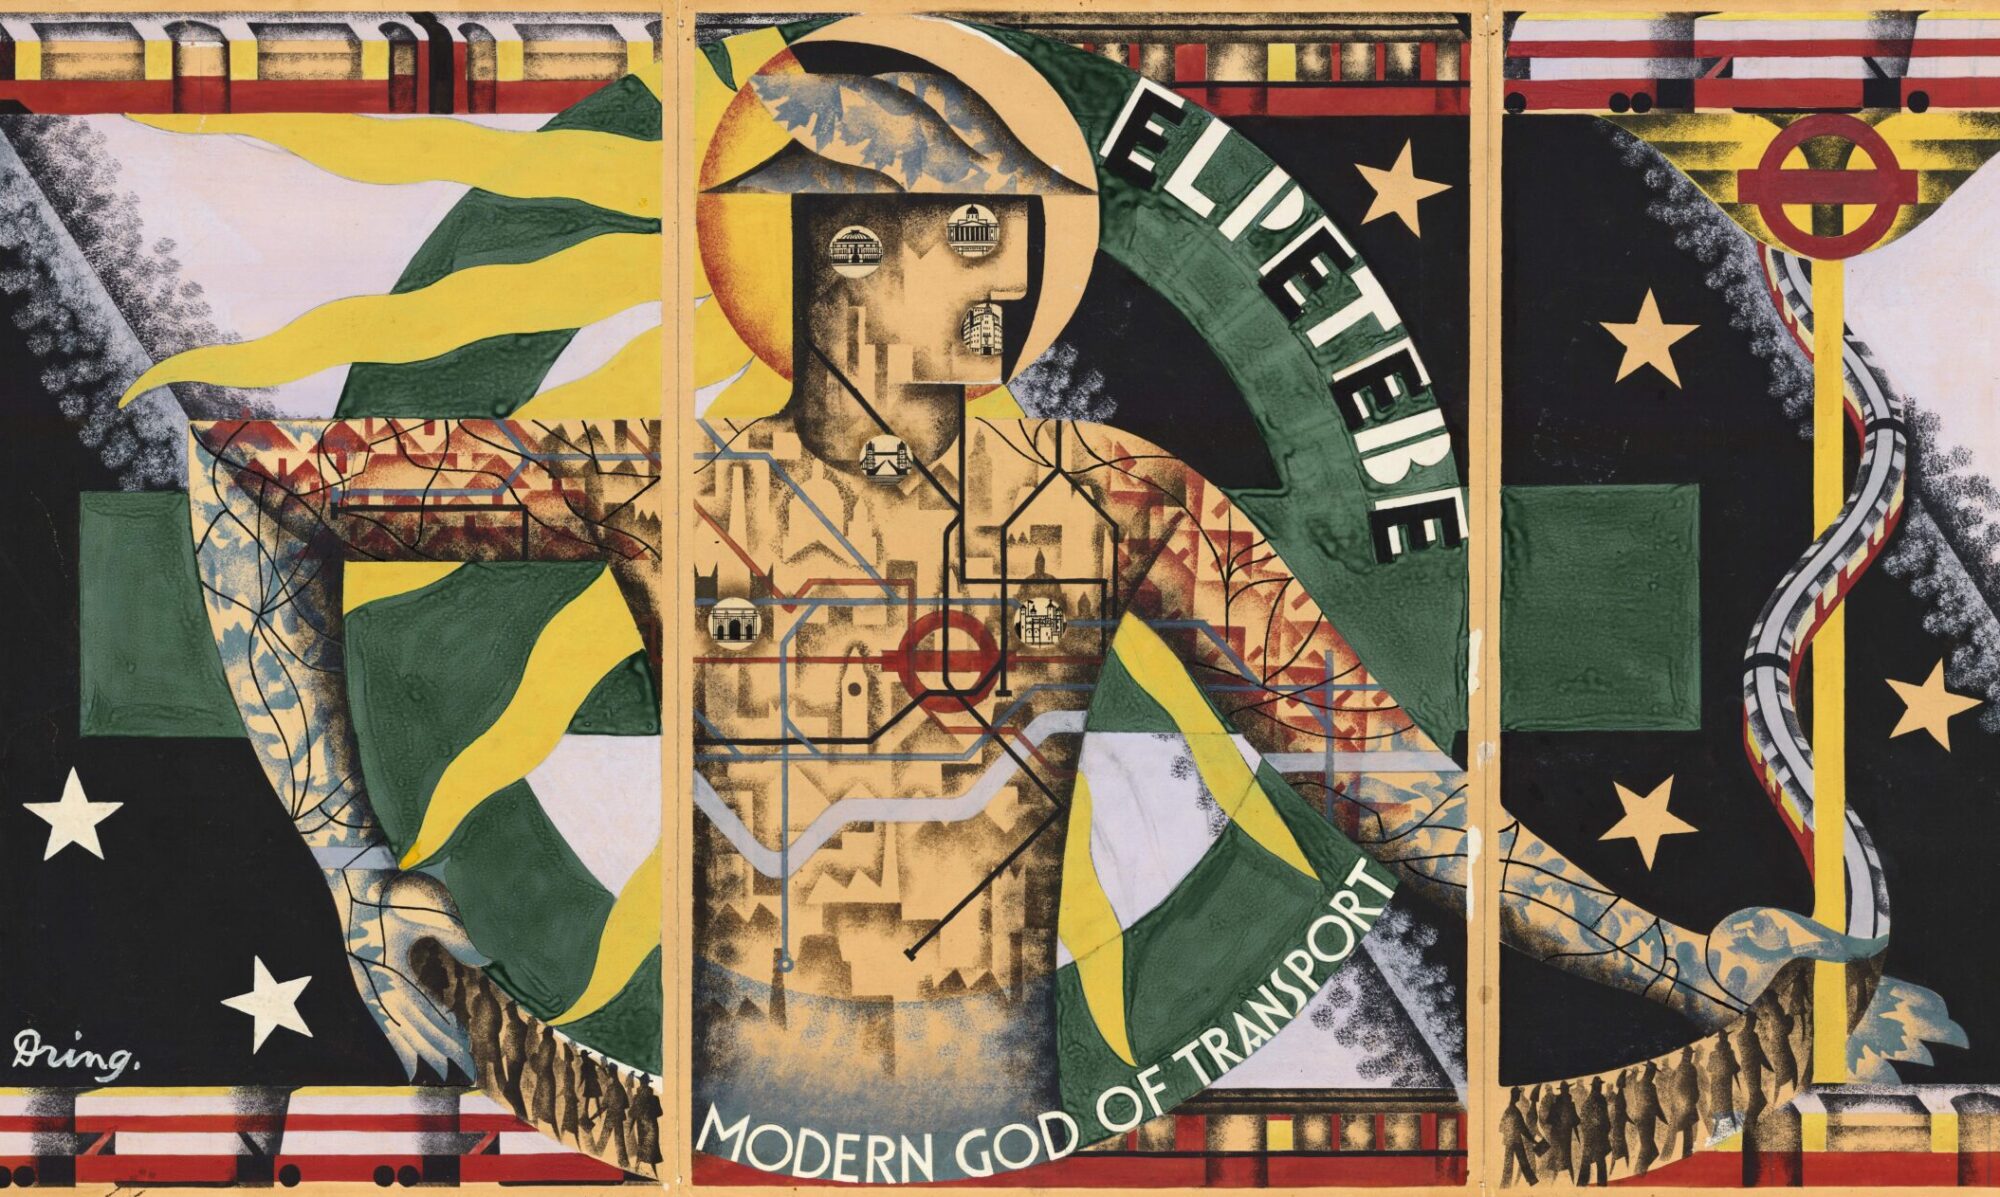
Connectivity is a book full of in-depth case studies that deserve a closer look, be it the relation between networks and colonial power in the case of French Saint-Simonianism, be it the early history of the telephone network, visual histories of network diagrams, the mobilities of the London Tube Map, Western and Eastern styles of logistics, and the unlikely inception of the ARPANET. It might be said that networks are a core cultural technique to allow for the migration of people, signs, and objects, which includes their disconnection. Connectivity of Things finally gives us a history that actor-network theory never dared to write itself.
We invite everyone at SHOT in Luxembourg to join the discussion, both in person and per hybrid participation. Our author-meets-critics session will combine key critical questions towards the book, and shall provide insights into the intricacies of such an (un-)timely and complex translation endeavor.
On The Connectivity of Things: Network Cultures since 1832
Author-meets-critics: Sebastian Giessmann (Siegen), Monika Dommann (Zurich), Cyrus Mody (Maastricht), Elizabeth Petrick (Rice), and Thomas Haigh (Wisconsin-Milwaukee)
Society for History of Technology Annual Meeting 2025
„Technologies of Migration – Migrating Technologies“
Esch-sur-Alzette, Luxembourg
Friday, October 10
12:55 PM – 2:10 PM

Blockchain vs. AI
 Both as imaginary and material network technologies, blockchain and ‘artificial intelligence’ tend to clash and mingle at the same time. Current neoconnectionist AI and blockchains follow very different cultural logics, just as neural networks differ from peer-to-peer networks sociotechnically. Maximum data intensity, large language models, tokenized media objects, modification of algorithms by data, operational statistics, plus the variation of existing patterns in the case of AI – data immutability, encryption, token economies and exact processing of algorithmic instructions in the case of blockchain. Together, blockchain and neoconnectionist AI are about to form what I call a seventh historical layer within my work on “The Connectivity of Things” in network cultures.
Yet, at the same time, blockchain and AI not only compete for parallel distributed processing power in data centers. They both share energy-intensive, extractive strategies that drive the booms and busts of too-late capitalism (Anna Kornbluh). While their network imaginaries are still being contested, naturalization and habitualization happen at an ever increasing pace. Sometimes, blockchain is now promoted as a slowing-down counter-infrastructure to AI’s accelerationist, generative media and its models. The paper is going to take a close look at controversial cases like Worldcoin, which is supposed to afford for a biometrical “proof-of-human” that attaches a digital identity to online content. While the cultural logics of blockchain and AI might seem to differ almost entirely on the infrastructural level, they are currently serving as a match made in hell when it comes to their political and economical appropriation.
[This is my contribution to the 4S open panel Network Imaginaries: Past, Present, and Future on September 4, 2025.]
Eineindeutigkeit. Digitale Aktenform und blockchainbasierte Transaktion
Der Beitrag rekonstruiert das Entstehen einer digitalen Aktenform im 21. Jahrhundert, mit der die eindeutige Nachvollziehbarkeit von Finanztransaktionen und Rechtsakten garantiert werden soll. Hierzu werden Blockchain-basierte Infrastrukturen – Bitcoin, Ethereum und Worldcoin – anhand der sie fundierenden technischen Whitepaper rekonstruiert und kontextualisiert. Gemeinsam ist diesen Infrastrukturen, wie auch dem PDF-Format, eine Produktion von ›Eineindeutigkeit‹, die grundsätzlich immer bearbeitbaren Daten einen fixen Wert zuschreibt. Gegenüber den intransparenten Akten generativer KI im maschinellen Lernen, so die These, bieten Blockchain-Medien die Option einer digitalen Fixierung, mit der alle möglichen sozialen, juristischen und ökonomischen Praktiken registriert und identifiziert werden.
Im Open Access erschienen als: Eineindeutigkeit. Digitale Aktenform und blockchainbasierte Transaktion. In: Plener, Peter/Wolf, Burkhardt (Hg.): Akte/n. Stuttgart: Metzler, 2025, S. 153–166.
https://doi.org/10.1007/978-3-662-70242-0_9
The Datafied Web
Do you remember …
… the beginnings of early metrics in the 90s?
… the birth of web counters?
… those digital pioneers that marked and
started to quantify the pulse of online activity?
… the novelty of seeing website visits
measured in real-time?
… eye-catching graphics becoming the currency of online attention?
… the early days of companies like
Webtrends, Urchin and DoubleClick?
The full RESAW 2025 program can be viewed on our conference website. Take a look at our exciting sessions and keynotes and enjoy your visit to RESAW 2025 at Siegen University’s own Media of Cooperation! You might also want to watch out for the hashtag #RESAW25 on Mastodon and elsewhere.
Das neue Geld der Öffentlichkeit: Wie gestalten wir den digitalen Euro?
Wir wollen mit Euch diskutieren! Über den digitalen Euro, seine Zukunft, seine Kontroversen, seine politische Philosophie, Medientheorie und Ökonomie. Alle Generationen brauchen digital cash. Aber wie gestalten wir als europäische Zivilgesellschaft ein neues Medium der Kooperation?
2025 wird ein entscheidendes Jahr für den digitalen Euro. Die Europäische Zentralbank steckt mitten in der Vorbereitungsphase für diese neue Form des Bargelds. Währenddessen stockt der nötige politische Prozess in Brüssel. Dabei ist das Projekt immer noch vielen Bürger:innen unbekannt: Im Juni 2024 wussten 59 Prozent der Deutschen nichts über die digitale Zentralbankwährung. Und wer schon davon gehört hat, vermutet vieles – angefangen bei der (keinesfalls geplanten) Abschaffung von Schein und Münze, befürchteter finanzieller Überwachung bis zur Einführung einer europäischen Kryptowährung.
Wenn wir ein neues Geld der europäischen Öffentlichkeit bis 2028 realisieren wollen, braucht es deshalb vor allem: mehr zivilgesellschaftliche Aufmerksamkeit für die digitale Zentralbankwährung, mehr und genaueres Wissen, mehr Deliberation und zivilisierten Streit, mehr Kooperation, kollektives Vorstellungsvermögen und politischen Willen. Die Philosophin Petra Gehring und der Medientheoretiker Sebastian Gießmann debattieren mit Euch, wie wir den digitalen Euro unter den aktuellen Bedingungen für alle Generationen gestalten können, und müssen.
26. Mai 2025
STATION Berlin
Stage 3
13:45-14:15 Uhr
Lehrveranstaltungen im Sommersemester 2025
Im Sommersemester 2025 biete ich folgende Lehrveranstaltungen in der Siegener Medienwissenschaft an:
- Geld, Geld, Geld (Seminar Medien- und Kulturtechnik, 1. Gruppe)
Unisono | Moodle - 100 Jahre „Die Gabe“: Ein Lektüreseminar zu Marcel Mauss
(Seminar Kulturwissenschaft, 1. Gruppe)
Unisono | Moodle - The Datafied Web
Unisono | Moodle - Forschungskolloquium
Unisono | Moodle
Worum geht es in den Lehrveranstaltungen?
Künstliche Intelligenz zwischen Spezialisierung und Universalisierung
Auf welche Zukunft in welchen neuen Umgebungen muss sich die Medien- und Kulturtechnikforschung angesichts der rezenten Konjunktur von Künstlicher Intelligenz ausrichten?
Der Vortrag kommt hierzu auf eine grundsätzliche Frage von Marcel Mauss zur Konstitution von Techniken zwischen speziellen und allgemeinen Zwecken zurück. Er bietet, erstens, eine kurze Lagebeschreibung zur gegenwärtigen Entwicklung des maschinellen Lernens und neuerer KI zwischen Spezialisierung und Universalisierung.
Kern meiner Argumentation ist, zweitens, eine natur- und kulturtechnische Genealogie. Sie fragt nach der historischen Wiederkehr konnektionistischer Praktiken, Algorithmen, Denk- und Handlungsstile als Bedingung der aktuellen KI-Technologien. Wie konnten aus biologischen Neuronen artifizielle neuronale Netze werden, die als infrastrukturelle Grundierung Künstlicher Intelligenz fungieren?
Auf dem Spiel stehen dabei, drittens, die Medien selbst. Sie werden aufgrund der Naturalisierung und Habitualisierung von konnektionistischer KI zu statistisch operationalisierten, datenintensiven Netzwerken.
Eine Wette mit Marcel Mauss
Dienstag, 21.01.2025, 12–13.30 Uhr
Universität zu Köln, Hauptgebäude, Hörsaal VIII
Small Forms in Circulation
I am happy to give a keynote at this conference of the Research Training Group “The Literary and Epistemic History of Small Forms”. It is called Infrastructures and/as Environments: Practices and Ecologies of Circulation. Feel free to join us and think collectively about “Small Forms in Circulation” at Humboldt University on November 28-30, 2024.
Testing the Social Network
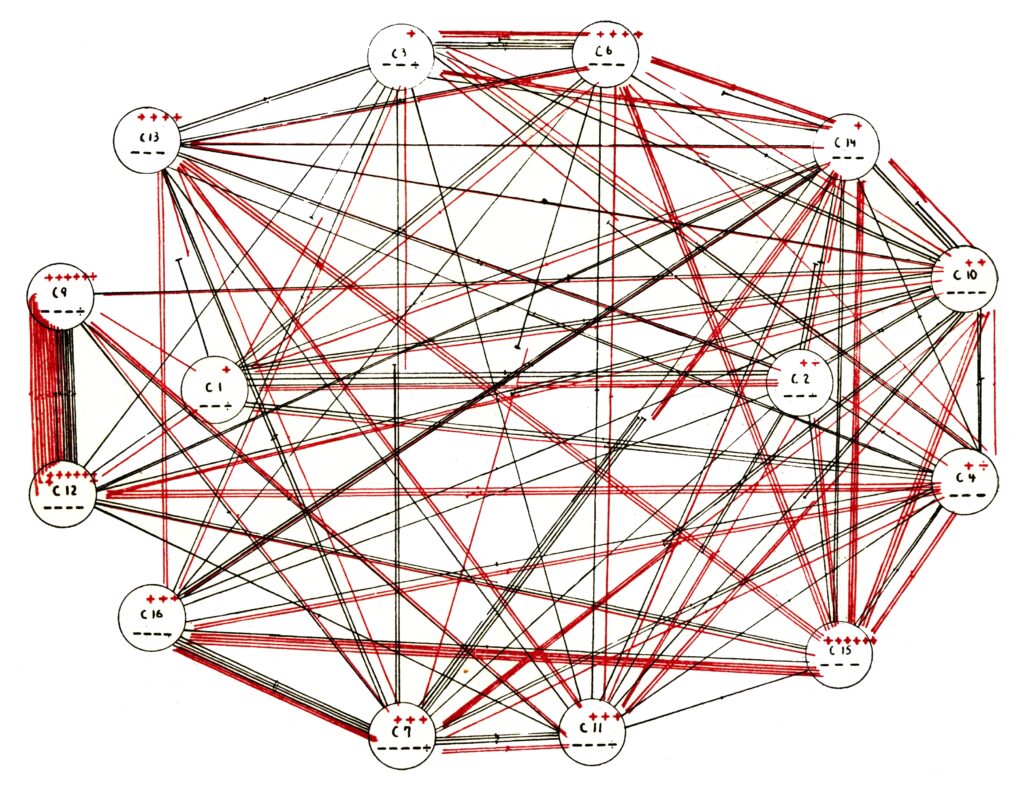
Blogging gets a bit harder throughout the start of the academic term. This is why I return to this series of image from The Connectivity of Things just now. Chapter 6 of the book tells a visual history of the network diagram. It follows the early history of graph theory in mathematics and chemistry. But the payoff here is a true crime history of sociology. While the name of Jacob Levy Moreno might sound familiar, the name of social psychologist Helen Hall Jennings is largely unknown even to scholars of social networks. Yet, it was Jennings who provided Moreno with a set of innovative methods to gather data on social relations. The sociometric test is what allowed for a visual formalization of a given network’s data. While Jennings still had a chapter of her own in the 1934 first edition of Moreno’s book Who Shall Survive, her work was hidden in a list of (numerous) references in the second edition of 1953. This is why I have started to reference both versions as written by Moreno and Jennings.
In the 1953 second edition, Moreno also made strong claims regarding “his” visual method of network visualization. A lot of the sociometric diagrams have been drawn by women though. Just consider an image like The Lady Bountiful, which was drawn by student assistant Pauline Lee in 1938. But in this case, Moreno’s copyright assertion for visualizing social networks has been more than mere rhetoric. His 1920s diagrams of stage movements in improvised theater (Das Stegreiftheater, 1924) can indeed be regarded as a crucial pathway towards visualizing dynamic social networks. But we should still be careful whom to give credit to when it comes to the methods of testing and visualizing social networks.


