Testing the Social Network

Blogging gets a bit harder throughout the start of the academic term. This is why I return to this series of image from The Connectivity of Things just now. Chapter 6 of the book tells a visual history of the network diagram. It follows the early history of graph theory in mathematics and chemistry. But the payoff here is a true crime history of sociology. While the name of Jacob Levy Moreno might sound familiar, the name of social psychologist Helen Hall Jennings is largely unknown even to scholars of social networks. Yet, it was Jennings who provided Moreno with a set of innovative methods to gather data on social relations. The sociometric test is what allowed for a visual formalization of a given network’s data. While Jennings still had a chapter of her own in the 1934 first edition of Moreno’s book Who Shall Survive, her work was hidden in a list of (numerous) references in the second edition of 1953. This is why I have started to reference both versions as written by Moreno and Jennings.

In the 1953 second edition, Moreno also made strong claims regarding “his” visual method of network visualization. A lot of the sociometric diagrams have been drawn by women though. Just consider an image like The Lady Bountiful, which was drawn by student assistant Pauline Lee in 1938. But in this case, Moreno’s copyright assertion for visualizing social networks has been more than mere rhetoric. His 1920s diagrams of stage movements in improvised theater (Das Stegreiftheater, 1924) can indeed be regarded as a crucial pathway towards visualizing dynamic social networks.  But we should still be careful whom to give credit to when it comes to the methods of testing and visualizing social networks.

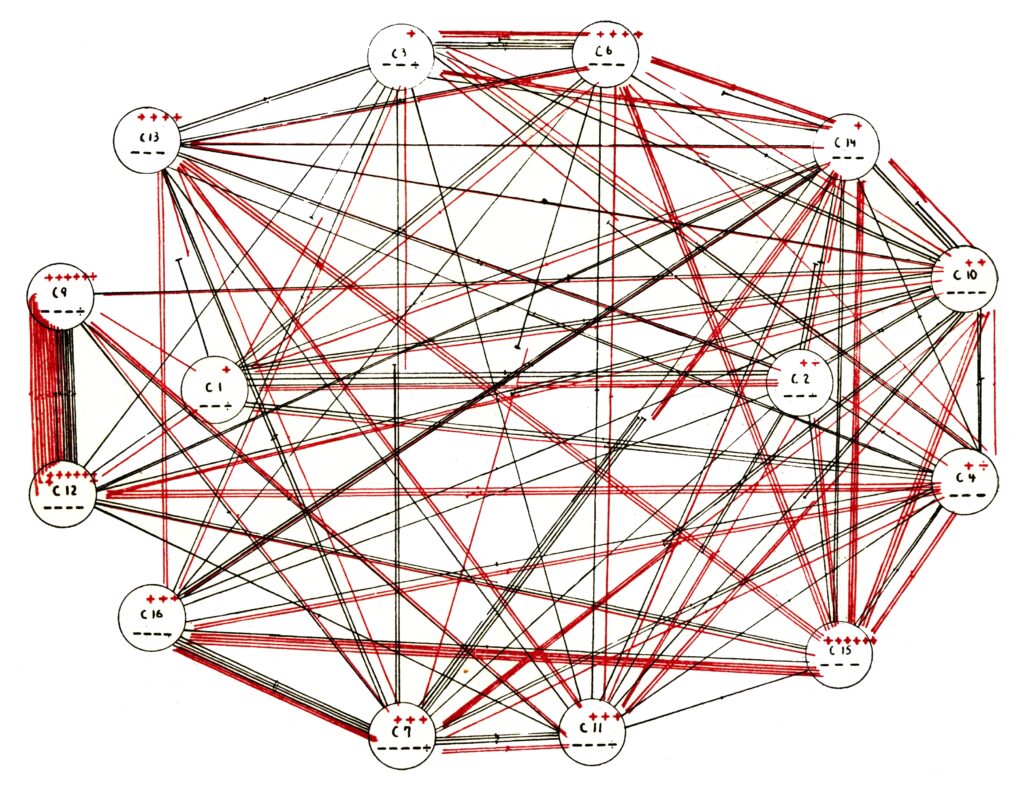
Jacob Levy Moreno (?), Psychological Geography Map IV. A Reduction Sociogram, 1934. A reduction of the overall map on which plus and minus operators provide the scale. Every plus codes ten attractions and every minus ten rejections in one cottage. Double points on a sign halve the points. Every red and black line between the cottages stands for five attractions or rejections. The total can be calculated by multiplying by five. This technique reduces the quantity of lines so that “large populations” can also be mapped.

The Connectivity of Things: Network Cultures since 1832

Nets hold, connect, and catch. They ensnare, bind, and entangle. Our social networks owe their name to a conceivably strange and ambivalent object. But how did the net get into the network? And how can it reasonably represent the connectedness of people, things, institutions, signs, infrastructures, and even nature? The Connectivity of Things by Sebastian Giessmann, the first media history that addresses the overwhelming diversity of networks, attempts to answer all these questions and more.

Reconstructing the decisive moments in which networking turned into a veritable cultural technique, Giessmann takes readers below the street to the Parisian sewers and to the Suez Canal, into the telephone exchanges of Northeast America, and on to the London Underground. His brilliant history explains why social networks were discovered late, how the rapid rise of mathematical network theory was able to take place, how improbable the invention of the internet was, and even what diagrams and conspiracy theories have to do with it all. A primer on networking as a cultural technique, this translated German classic explains everything one ever could wish to know about networks.

A media history of the material and infrastructural features of networking practices, a German classic translated for the first time into English.

The MIT Press, Infrastructures Series
October 15, 2024
444 pp., 6 x 9 in, 82 b&w illus.
Open Access version: https://doi.org/10.7551/mitpress/12547.001.0001

„The Connectivity of Things: Network Cultures since 1832“ weiterlesen

Drawing the Social: Jacob Levy Moreno, Sociometry, and the Rise of Network Diagrammatics

Drawing the SocialThis text was originally written for a collaborative volume edited by Ursula Frohne and Anne Thurmann-Jajes on Art ‘In-Formation’. Communication Aesthetics and Network Structures. Within its pre-print publication at the CRC „Media of Cooperation“ it remains in its original form, although research on diagrammatics, the history of networking, and Moreno himself has developed further. Most notably, Moreno’s son-turned-sociologist has written a popular book about him: Jonathan D. Moreno, Impromptu Man: J.L. Moreno and the Origins of Psychodrama, Encounter Culture, and the Social Network (New York: Bellevue Literary Press, 2014).

The following article discusses the combination of graphical methods and network thought in early sociology. It combines a case study of Jacob Levy Moreno’s sociometric work and diagrammatic practice with media-theoretical thoughts about the characteristics of network diagrams. These are understood as inscriptions that perform both an act of drawing and writing at the same time. Moreno’s mappings, as well as other early visual techniques of social research, are understood along Michel Serres’ understanding of the network diagram as a topo­logical narration. Seen from the vantage point of a history of knowledge, Moreno’s sociometric and performative practices can not only be understood as a contribution to social network thought, but as actual research on the cooperative character of human interaction.